Visualization Capabilities for a detailed analysis

Airspect SRS from PATTERN EXPERT offers the user many options of visualization for a save and accurate diagnosis.
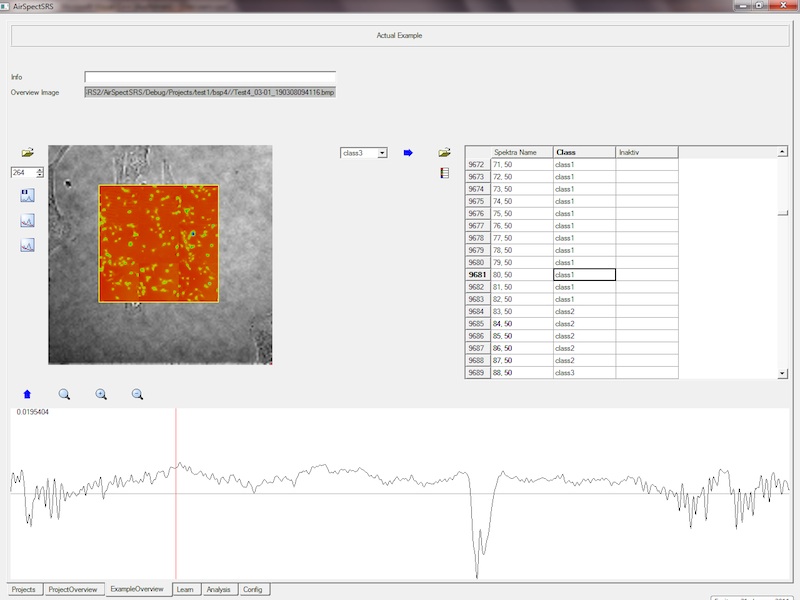
Clear arranged visualizations, such as the display of the overview screen and the corresponding spectra, admit the user to analyze
the data exactly. It is possible to optimize the presentation of the overview image by using the image processing methods. Furthermore, you
can select one or more pixels in the image and display their corresponding spectra. Conversely, the pixels of the selected spectra
are highlighted and the class affiliation probability is displayed simultaneously. It is possible to bring out the average spectrum
and the areas standard deviation for all the selected spectra.
Likewise it is feasible either to visualize the midpoint (average value) of the amplitude values of the entire spectra or of the wave
fields as a spectral image.
Detailed studies of the individual images and spectra can be carried out with the zoom function. For a detailed diagnosis, you can
display the pixels of the image in the colors of the spectra associated classes (class picture). Thereby, the
gradation of the brightness indicates the probability of belonging (of the spectra to the class). In addition, airspect SRS offers
also the visualization of different images (class, spectra, overview) and results for direct comparison.
 Spectroscopy Techniques