Visualization
Various visualization tools allow for an extensive inspection of your spectra.
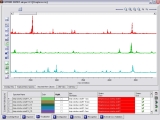
Compare the graphical representations of different spectra (either in one common diagram or in separate diagrams).
Compare the mean curves and standard deviations of the individual classes. Use the representation of spectra in their
common class colors to receive a first impression of those spectral features, which are characteristic of your classes.
Keep track of the effects of the various
preprocessing steps
by visual inspection of selected spectra before and after each individual step.
View the first and second derivatives of the preprocessed spectra. In many cases, the different class characteristics are most easily discovered
in the first derivative curves.
Have a look at your spectra in a perspective ("2.5 dimensional") view.
The so-called "GelView" gives you a top view of your spectra. This offers an entirely different and very interesting representation.

Various conversions can be applied to the spectra for visualization:
- transmittance - absorbance
- reflectance - absorbance (according to Kubelka-Munk)
- wavenumber - wavelength
- many different measurement units
- reversing the abscissa
 Spectroscopy Techniques